


3fin Weekly Briefing #8
Prime Day, OPS vs SPS, Amazon Marketing Cloud (AMC) and 3fin News

Today’s Menu
Prime Day is Live!
Deepdive: Ordered Product Sales (OPS) vs. Shipped Product Sales (SPS)
Tip of the Week: Leveraging Amazon Marketing Cloud (AMC)
3fin News: Expense Dashboard Goes Live!
News of the Week
Amazon Prime Day is Live: On July 16th and 17th, 2024, millions of shoppers will flock to Amazon to snag the best deals of the year. Let's make this year's Prime Day a record-breaking success for your Amazon business!
Amazon celerbrates its 30-year birthday: It has been 30 years since Jeff Bezos officially incorporated Cadabra Inc. - Amazon’s original name - on July 5, 1994. An interesting milestone when you think about what Jeff Bezos told his employees a few years ago: “Amazon is not too big to fail. In fact, I predict one day Amazon will fail. Amazon will go bankrupt. If you look at large companies, their lifespans tend to be 30-plus years, not a hundred-plus years.”
Will Nike Make its Come-back on Amazon? Nike, which formally exited Amazon in 2019, might return within 18 months due to its struggling direct-to-consumer strategy and recent plummeting sales. With a significant decline in market value and flat results in 2024, leveraging Amazon's vast reach could help stabilize and grow Nike's market presence, according to Walsh.
Deepdive: Ordered Product Sales vs. Shipped Product Sales
Navigating Amazon's vast array of data can be challenging, especially when numbers vary across different reports. This week, we demystify the discrepancies between Ordered Product Sales (OPS) and Shipped Product Sales (SPS) in Amazon's Seller Central reports.
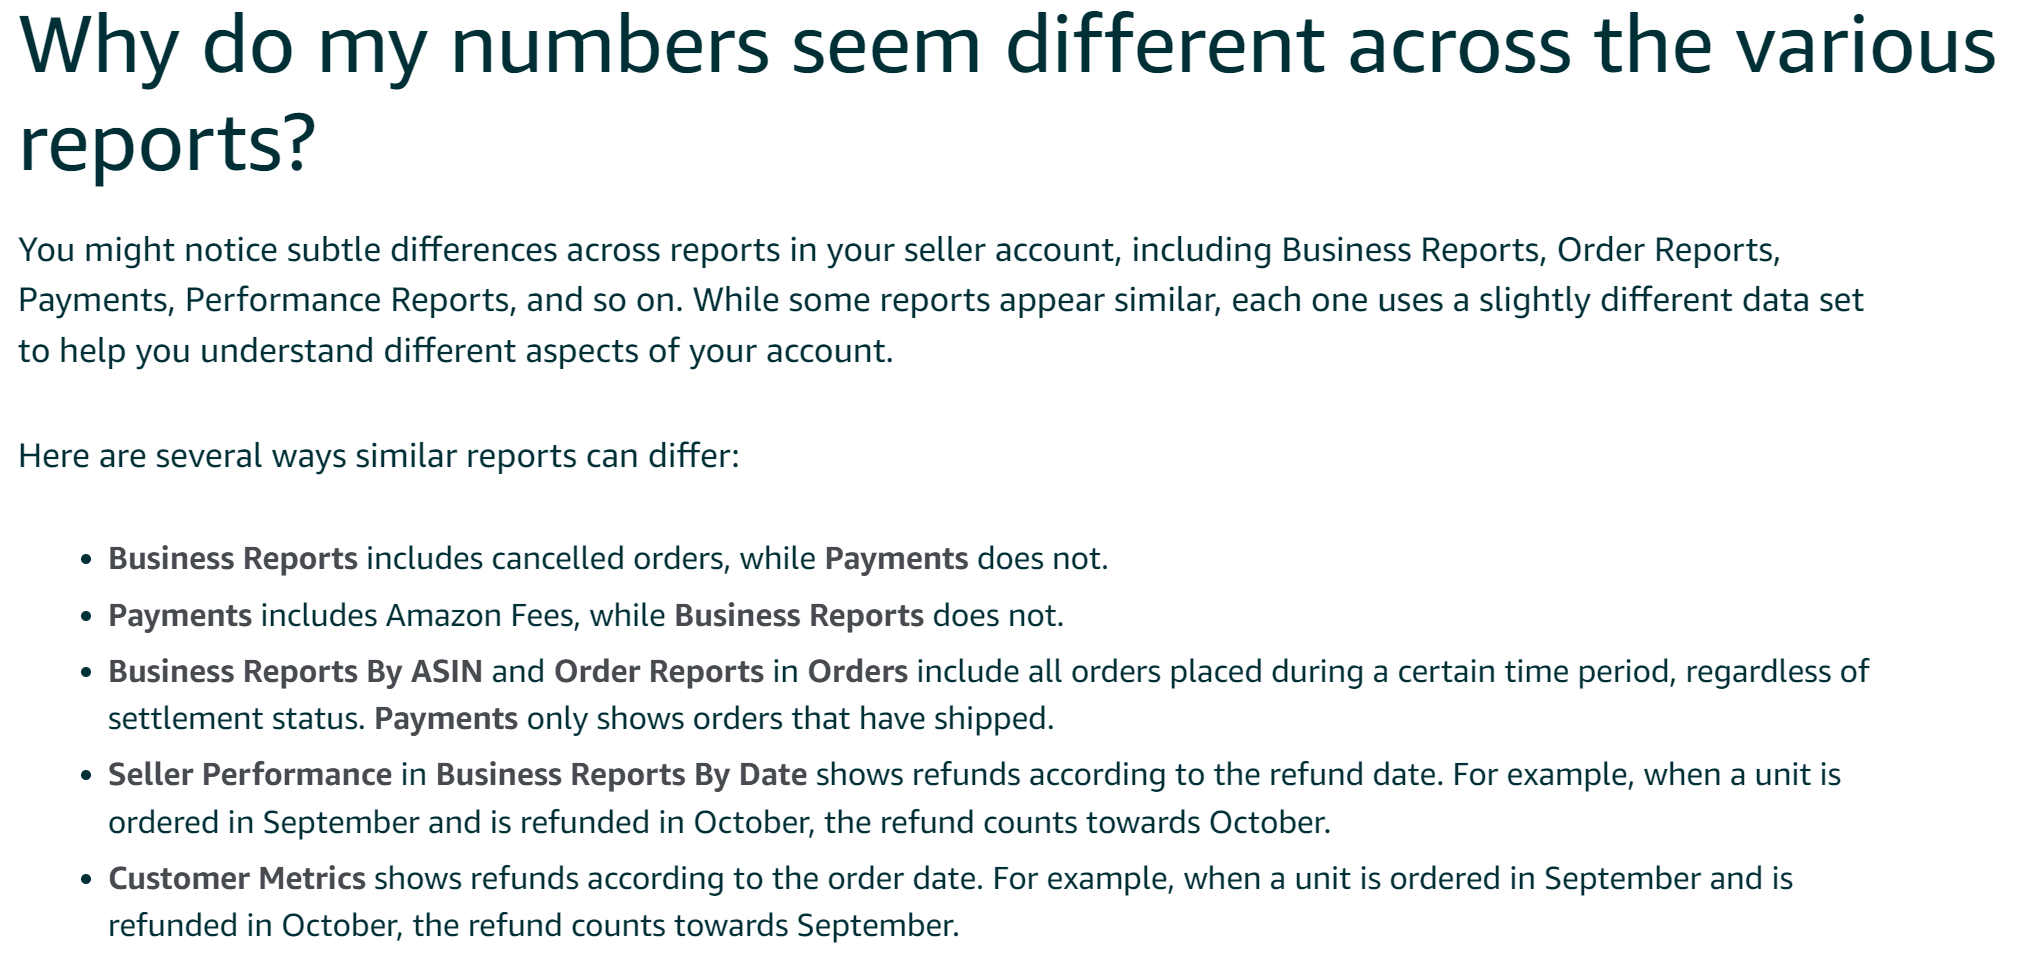
Why Do Amazon Reports Show Different Numbers?
Ever noticed that your sales dashboard, business reports, and payment reports don't match up? The reason is simple: they use slightly different data. For instance, the same metric, like units sold, can mean different things depending on the report. Amazon advises against trying to reconcile these differences due to these data variations.
If you’re wondering how the Amazon reports typically differ, here is the official answer from Amazon iteself:
Understanding Ordered Product Sales (OPS)
Ordered Product Sales (OPS) reflect the total value of products ordered by customers within a specific timeframe, regardless of whether they've been shipped. This metric offers a real-time snapshot of product demand.
Is OPS Accurate? While OPS provides immediate insights into customer demand, it doesn't account for cancellations and refunds, which can distort the true revenue picture. Thus, from an accounting perspective, OPS figures may not accurately represent your financial health.
Reports Using OPS: OPS data appears in Amazon Business Reports (Sales & Traffic), Orders Reports, and the Seller Central Sales Dashboard.
Understanding Shipped Product Sales (SPS)
Shipped Product Sales (SPS) include only transactions where products have been paid for and shipped. This metric provides an accurate measurement of revenue, considering completed sales from payment to delivery.
Is SPS Accurate? Yes, SPS is the most reliable metric for financial analysis as it accounts for cancellations and refunds. It offers a clear view of profitability, aiding in accurate financial reporting and cash flow management.
Reports Using SPS: SPS data is found in Amazon’s Payment and Settlement Reports.
Which Metric Should You Use?
Below is a table that summarizes the key differencees between OPS and SPS.
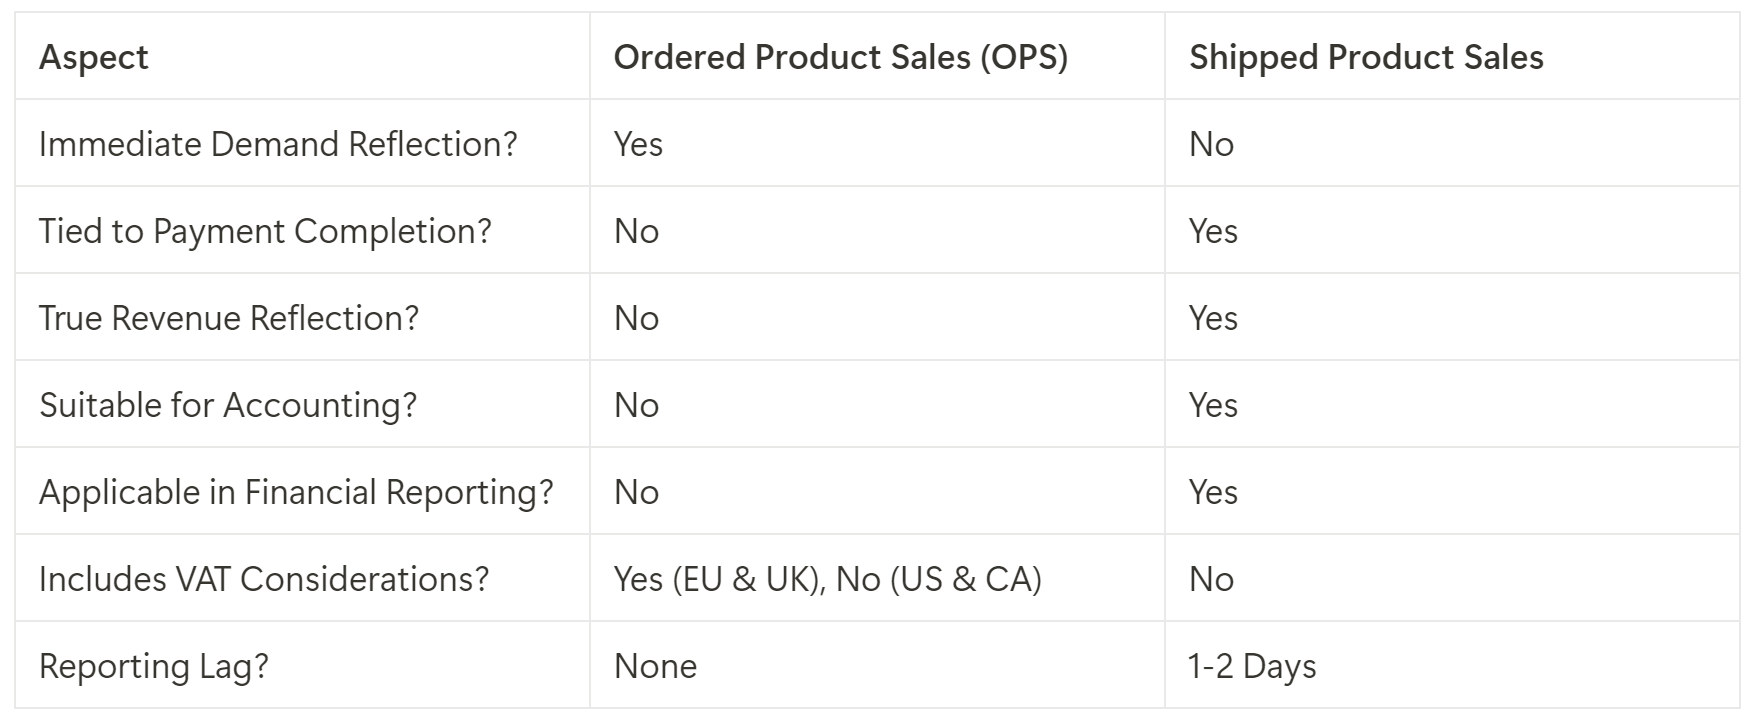
For Immediate Demand Insights: Use OPS to monitor real-time customer interest, spot trends, and optimize listings.
For Accurate Financial Analysis: Use SPS to understand true revenue and profitability, ensuring reliable financial reporting.
PS: 3fin’s Dashboards include both OPS and SPS data, so you always have the right data depending on the insights you need!
Tip of the Week: Leveraging Amazon Marketing Cloud (AMC)
If you're an Amazon seller or agency looking to supercharge your marketing efforts, Amazon Marketing Cloud (AMC) could be your game-changer. AMC is a powerful analytics tool that helps you uncover detailed insights about your ad campaigns and customer behavior. Here's how you can make the most of it:
Understand Customer Journeys: Use AMC to analyze the complete customer journey from awareness to purchase. This helps in identifying which touchpoints are driving conversions and where potential customers are dropping off.
Optimize Ad Spend: By leveraging AMC’s granular data, you can see which campaigns and keywords are delivering the best ROI. This enables you to allocate your budget more effectively and cut down on wasted ad spend.
Enhance Audience Targeting: Gain insights into the demographics and interests of your audience. Use this data to create more personalized and effective ad campaigns that resonate with your target market.
Measure Cross-Channel Performance: AMC allows you to track the performance of your campaigns across different channels. Understanding how your ads perform on Amazon versus other platforms can help you fine-tune your overall marketing strategy.
Utilize AMC Reports: Make use of the pre-built and customizable reports in AMC to get a quick snapshot of your campaign performance. These reports can save you time and provide actionable insights at a glance.
By integrating AMC into your marketing toolkit, you can gain a deeper understanding of your customers, optimize your ad spend, and ultimately drive more sales.
3fin News: New Expense Dashboard
3fin just got a lot better - we’re thrilled to announce our brand-new Expenses Dashboard!

Key Features:
In-Line Editor for Expenses: Easily input any non-Amazon expense directly into 3fin. Whether it's a virtual assistant's salary, marketing costs, or an accountant's fee, you can now seamlessly add and manage all your expenses.
One-Off and Recurring Expenses: 3fin supports both single-instance expenses and recurring costs. You can also specify the brand or marketplace to which each expense belongs, providing a clear and organized view of your finances.
Categorization and Vendor Classification: Classify your expenses by category and vendor for better tracking and reporting. This feature ensures you have a detailed breakdown of where your money is going.
Filterable and Searchable Expense Table: The expense table is fully filterable and searchable, allowing you to quickly find and review any incurred expenses.
Sales vs. Expenses Graph: Our dashboard also includes a Sales vs. Expenses graph, giving you a visual representation of these key metrics over any chosen date range. This tool helps you easily monitor and manage your financial performance.
We’re confident that this new dashboard will significantly enhance your financial tracking and reporting capabilities. As always, we look forward to your feedback and hope you enjoy using the new Expenses Dashboard as much as we do!
We hope you’ve enjoyed this week’s briefing. If you wish to learn more about 3fin, you can book a call or try it for free.
If you enjoyed this newsletter, don’t forget to subscribe and share it with your network!